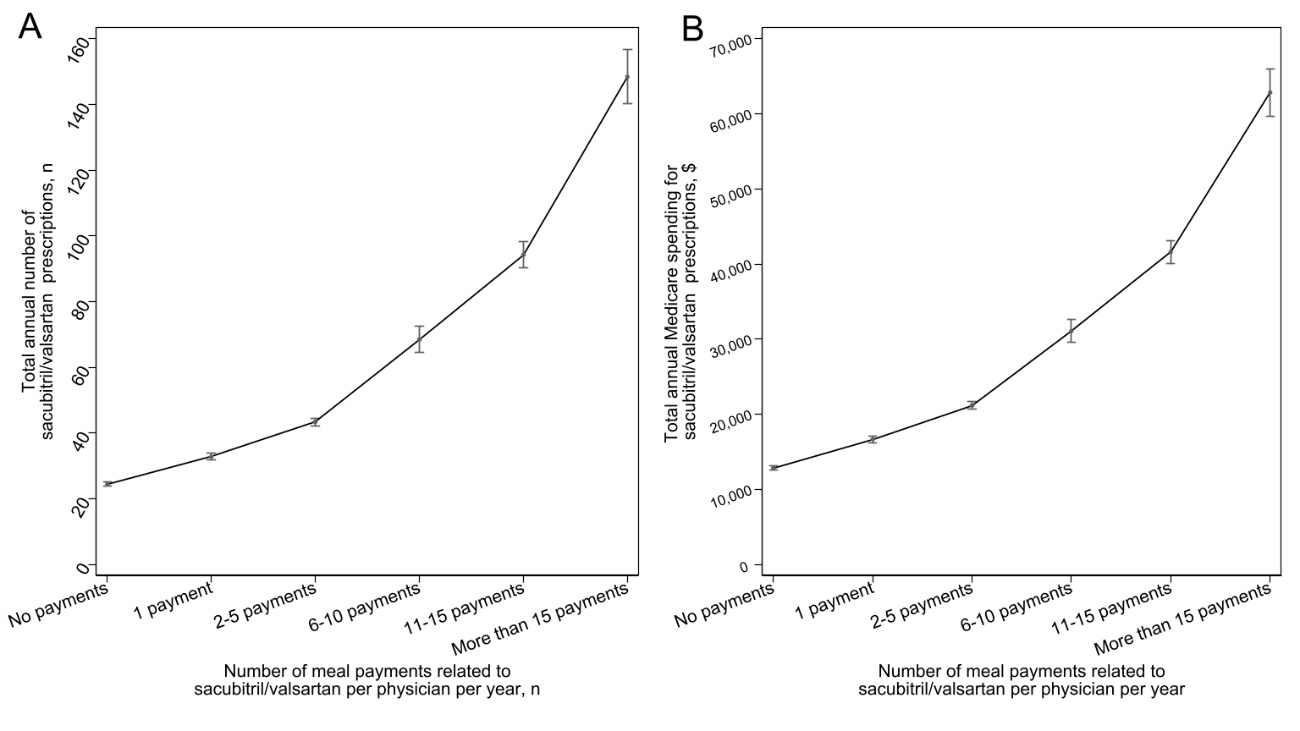
Abstract: RationaleHealthcare industry sometimes make large marketing payments to physicians. Previous studies have demonstrated that there are significant associations between industry marketing practices and physicians’ prescribing behaviors in several specialties. Given that current increasing introduction of many novel biologics for atopic dermatitis and increasing payments to dermatologists, the industry payments to dermatologists for atopic dermatitis drugs could be associated with their prescribing patterns in the United States. Aims and objectives:This study aims to evaluate association between dermatologists’ dupilumab prescription behaviors and manufacturer’s sponsored meal payments to dermatologists in the United States. Method Using the Centers for Medicare and Medicaid Services and the Open Payments Database, this cross-sectional analysis evaluated associations between manufacturer’s sponsored meal payments to dermatologists related to dupilumab and dermatologists’ dupilumab prescriptions between 2017 and 2021. Associations were evaluated using logistic generalized estimating equations (GEE) and negative binomial regression GEE models at individual dermatologist level. ResultsAmong 2852 dermatologists prescribing dupilumab, 74.5% received meal payments, amounting to $1,083,919 between 2017 and 2021. Dermatologists receiving meal payments were more likely to prescribe dupilumab (odds ratio 1.50, 95% CI: 1.37-1.65). There were also consistent dose-response associations between meal payments and total claims as well as Medicare spending. Dermatologists who received 1, 2-5, 6-10, and 11-15 meal payments per year reported 1.13 (95% CI: 1.03 – 1.24, p<0.05), 1.35 (95% CI: 1.24 – 1.46, p<0.001), 1.64 (95% CI: 1.48 – 1.82, p<0.001), and 2.10 (95% CI: 1.78 – 2.47, p<0.001) times more dupilumab-related claims in the year when they received the payments than those who did not receive the payments, respectively. ConclusionThis study found that significant associations between industry-sponsored meal payments and increased dupilumab prescriptions, shedding light on the potential influence of financial relationships on clinical practice. The findings call for heightened awareness among dermatologists, patients, and policy makers regarding the impact of these relationships on healthcare expenditures and decision-making in the United States. Future research is warranted to further explore these associations longitudinally. IntroductionDupilumab, the first biologic approved for moderate-to-severe atopic dermatitis (AD) in 2017, demonstrates both clinical and economic efficacy in the treatment of the disease:1,2 however, it may impose a financial burden on patients. Additionally, four novel drugs such as ruxolitinib (approval date: September 2021), tralokinumab (approval date: December 2021), abrocitinib (approval date: January 2022), upadacitinib (approval date: January 2022) were approved for AD in the United States.3 Nevertheless, no head-to-head clinical trials have been conducted to evaluate the safety and efficacy of these drugs, and there is no consensus on which drugs are more suitable than others and who should receive them.3 Thus, the importance of engaging in shared decision-making with patients cannot be overstated. The increasing introduction of novel AD drugs has led to fierce competition among the manufacturers and increased marketing activities to dermatologists, as a previous study showed that mean non-research payments from the healthcare industry to dermatologists increased by 11.7% each year.4 Prior investigations have shown that there are significant associations between industry payments to physicians and physicians’ prescribing behaviors in several specialties other than dermatology.5-12 However, to date, no research has explored the association between industry payments to dermatologists and their clinical practices. This study aimed to evaluate the associations between industry payments to dermatologists related to dupilumab and their dupilumab prescribing patterns in the United States. MethodsThis cross-sectional analysis examined the association between the industry payments to dermatologists and their prescriptions and Medicare expenditures for dupilumab in the United States, using the Centers for Medicare and Medicaid Services and Open Payments Database. As of March 2023, the 2021-Medicare Part D file was the latest available, analyzable dataset. Of the three biologic therapies approved for AD in the United States, only dupilumab was prescribed by more than 20 physicians. Given these circumstances, this study evaluated only the association between industry payments to dermatologists and the dermatologists’ dupilumab prescribing patterns. All dermatologists who prescribed more than 10 claims of dupilumab in a single year between 2017 and 2021 were identified from the publicly accessible Medicare Part D database. The publicly accessible Medicare Part D database only includes information of prescribers who reported more than 10 claims for a drug in a single year, to protect patients’ privacy.13 Then, matching the extracted dermatologist prescribers’ National Provider Identifier numbers, general payments for food and beverage (hereby meal payments) to the dermatologists were extracted from the Open Payments Database between 2017 and 2021, as previously noted.7,14-17 This study only considered meal payments, as previous studies showed that, of several payment categories, meal payments were strongly associated with increased drug prescriptions and healthcare costs in the United States.6,8,13,18,19 The association between meal payments for dupilumab and the dupilumab prescriptions was evaluated using a logistic generalized estimating equation (GEE), adjusting for the covariates including gender, practice region, years in practice, the graduated medical schools, and payment/prescribed year.7 Furthermore, the associations between the number of payments and the total number of 30-day standardized claims and Medicare expenditures were examined using negative binomial regression GEE models, because the prescription variables were highly skewed, as in a previous study.6,20 The number of annual meal payments per physician was categorized into six groups: no payment, one payment, 2-5 payments, 6-10 payments, 11-15 payments, and more than 15 payments. All statistical analyses were performed using Python 3.9.12 (Python Software Foundation, Beaverton, OR, USA), Microsoft Excel, version 16.0 (Microsoft Corp., Redmond, WA, USA), and Stata version 17.0 (StataCorp, College Station, TX, USA). This study only considered publicly available information and was designed as a non-human subjects study, ethical review and approval were not required. ResultsA total of 2852 dermatologists prescribed 146,324 claims of dupilumab entailing $470.0 million in Medicare expenditures between 2017 and 2021. Among them, 74.5% received 39,859 meal payments associated with dupilumab, totaling $1,083,919 during the same period. The average number of meal payments per dermatologist per year was 5.3, with an average cost per meal of $27.2. Dermatologists receiving meal payments were more likely to prescribe dupilumab with an odds ratio of 1.50 (95% confidence interval [CI]: 1.37-1.65, p<0.001 in the year they received the payment compared to those who did not receive meal payments. Additionally, there were consistent dose-response associations between the number of industry-sponsored meals for dupilumab and the total claims (Figure 1A) and total Medicare spending (Figure 1B) at the individual dermatologist level. Dermatologists who received 1, 2-5, 6-10, and 11-15 meal payments per year reported 1.13 (95% CI: 1.03 – 1.24, p<0.05), 1.35 (95% CI: 1.24 – 1.46, p<0.001), 1.64 (95% CI: 1.48 – 1.82, p<0.001), and 2.10 (95% CI: 1.78 – 2.47, p<0.001) times more dupilumab-related claims in the year when they received the payments than those who did not receive the payments, respectively (Table 1). Similarly, dermatologists who received 1, 2-5, 6-10, and 11-15 meal payments reported 1.16 (95% CI: 1.04 – 1.29, p<0.01), 1.40 (95% CI: 1.28 – 1.53, p<0.001), 1.75 (95% CI: 1.56 – 1.96, p <0.001), and 2.28 (95% CI: 1.90 – 2.73, p<0.001) times higher Medicare expenditures related to dupilumab than those who did not, respectively (Table 1). Adjusted mean annual Medicare expenditures for dupilumab were $30,408 (95% CI: $28,416 – $32,400) in dermatologists without payments, $36,385 (95% CI: $32,496 – $40,274) in dermatologists with one meal payment, $44,674 (95% CI: $41,151 – $48,198) in dermatologists with 2-5 meal payments, and $57,486 (95% CI: $51,453 – $63,520). DiscussionThis study represents the first analysis elucidating the associations between industry-sponsored meal payments to dermatologists and their prescription patterns for dupilumab in the United States. This study found that there were strongly significant associations between industry-sponsored meal payments to dermatologists related to dupilumab and the dermatologists’ dupilumab prescriptions in the United States. These findings were consistent with numerous previous studies in other specialties.5,6,10-12,18,19,21 Additionally the findings highlight the potential influence of industry payments to dermatologists on their clinical practice, though dupilumab significantly improves quality of life and disease control in patients with moderate-to-severe AD.1,2 Furthermore, novel drugs for severe atopic dermatitis, such as tralokinumab, abrocitinib, and upadacitinib, have been introduced for the past few years,3 but the lack of direct head-to-head evidence of the safety and efficacy of these new drugs has led to fierce marketing competition and increasing marketing activities to physicians among the manufacturers.4 With the increasing introduction of novel drugs, marketing costs to dermatologists may increase, and dermatologists' treatment choices may be further influenced by information provided by pharmaceutical manufacturers and/or payments and meal provided by the manufacturers. To evaluate this hypothesis, we need further longitudinal research on associations between industry payments to dermatologists and the dermatologists’ clinical practice. The association between industry payments to dermatologists and dermatologists’ prescribing patterns does not necessarily mean inappropriate prescriptions influenced by the healthcare industry. Also, the associations were not necessarily causality, as this study is observational cross-sectional analysis. Patients may want to know that many dermatologists receive non-research payments from the healthcare industry and that there are associations between these payments and dermatologists' prescribing patterns, as shown in previous studies.22-25 Nevertheless, very few patients and people are aware that their physicians received industry payments, these payments could influence physicians’ clinical practice, and the payment information is available from the US government online database.24,26 Since January 2023, physicians licensed in California are legally required to notify their patients about payment information disclosed in the Open Payments database. Transparency is one of the key aspects improving patient-centered care and can foster shared decision-making with patients.27 Thus, all dermatologists should be transparent in their financial relationships with the healthcare industry, disclose these information to their patients and integrate into shared decision-making process when discussing treatment options with patients . However, this study has several limitations. First, this observational study can only establish associations and not necessarily causality between payments and dermatologists' prescriptions. Second, there may be unmeasured confounding factors, such as the patient number and the content and reasons behind the payments provided to the dermatologists.14-16 Additionally, this study exclusively relied on prescription data from the Medicare Part D database, which may have led to underestimations of the prescription amounts of dupilumab.6,13,18 In conclusion, at least, this study provided to all dermatologists, patients, and policy makers that the industry sponsored meal payments to dermatologists were significantly associated with higher dupilumab prescriptions and large healthcare expenditures in the United States. Thus, all dermatologists need to pay more attention to their financial relationships with the healthcare industry and the impact these relationships may have on their clinical practices. References 1. Simpson EL, Bieber T, Guttman-Yassky E, et al. Two Phase 3 Trials of Dupilumab versus Placebo in Atopic Dermatitis. N Engl J Med. Dec 15 2016;375(24):2335-2348. doi:10.1056/NEJMoa16100202. Zimmermann M, Rind D, Chapman R, Kumar V, Kahn S, Carlson J. Economic Evaluation of Dupilumab for Moderate-to-Severe Atopic Dermatitis: A Cost-Utility Analysis. J Drugs Dermatol. Jul 1 2018;17(7):750-756. 3. Ratchataswan T, Banzon TM, Thyssen JP, Weidinger S, Guttman-Yassky E, Phipatanakul W. Biologics for Treatment of Atopic Dermatitis: Current Status and Future Prospect. J Allergy Clin Immunol Pract. Mar 2021;9(3):1053-1065. doi:10.1016/j.jaip.2020.11.0344. Murayama A. Industry payments to dermatologists in the United States: A nine-year analysis of the Open Payments Database between 2013 and 2021. Authorea Preprints. 2023;5. Mitchell AP, Trivedi NU, Gennarelli RL, et al. Are Financial Payments From the Pharmaceutical Industry Associated With Physician Prescribing? : A Systematic Review. Ann Intern Med. Mar 2021;174(3):353-361. doi:10.7326/M20-56656. Inoue K, Tsugawa Y, Mangione CM, Duru OK. Association between industry payments and prescriptions of long-acting insulin: An observational study with propensity score matching. PLOS Medicine. Jun 2021;18(6):e1003645. doi:10.1371/journal.pmed.10036457. Murayama A. Pharmaceutical industry-sponsored meals and prescriptions of biologics for asthma. J Allergy Clin Immunol Pract. May 26 2023;doi:10.1016/j.jaip.2023.05.0308. Murayama A. Industry-sponsored meals are associated with increased prescriptions and Medicare expenditures on brand-name colchicine in the United States. Authorea Preprints. 2023;9. Duarte-Garcia A, Crowson CS, McCoy RG, et al. Association Between Payments by Pharmaceutical Manufacturers and Prescribing Behavior in Rheumatology. Mayo Clin Proc. Feb 2022;97(2):250-260. doi:10.1016/j.mayocp.2021.08.02610. Hollander MA, Donohue JM, Stein BD, Krans EE, Jarlenski MP. Association between opioid prescribing in Medicare and pharmaceutical company gifts by physician specialty. Journal of general internal medicine. 2020;35(8):2451-2458. 11. Mitchell AP, Winn AN, Lund JL, Dusetzina SB. Evaluating the Strength of the Association Between Industry Payments and Prescribing Practices in Oncology. https://doi.org/10.1634/theoncologist.2018-0423. The Oncologist. 2019/05/01 2019;24(5):632-639. doi:https://doi.org/10.1634/theoncologist.2018-042312. Fleischman W, Agrawal S, Gross CP, Ross JS. Association of Pharmaceutical Manufacturer Payments to Physicians and Prescribing Dosage of Opioids. J Gen Intern Med. Jul 2019;34(7):1074-1076. doi:10.1007/s11606-019-04897-913. DeJong C, Aguilar T, Tseng C-W, Lin GA, Boscardin WJ, Dudley RA. Pharmaceutical Industry–Sponsored Meals and Physician Prescribing Patterns for Medicare Beneficiaries. JAMA Internal Medicine. 2016;176(8):1114-1122. doi:10.1001/jamainternmed.2016.276514. Murayama A, Kugo H, Saito Y, Saito H, Tanimoto T, Ozaki A. A Nine-year Investigation of Healthcare Industry Payments to Pulmonologists in the United States. Ann Am Thorac Soc. Mar 24 2023;doi:10.1513/AnnalsATS.202209-827OC15. Murayama A, Kamamoto S, Kugo H, Saito H, Ozaki A. Research and Nonresearch Industry Payments to Nephrologists in the United States between 2014 and 2021. J Am Soc Nephrol. Jul 25 2023;doi:10.1681/asn.000000000000017216. Murayama A, Hirota S. Industry payments to pathologists in the USA between 2013 and 2021. J Clin Pathol. Apr 21 2023;doi:10.1136/jcp-2023-20890117. Murayama A, Kamamoto S, Higuchi K, Shigeta H, Ozaki A. Trend in Industry Payments to Rheumatologists in the United States During the COVID-19 Pandemic Between 2013 and 2021. J Rheumatol. Apr 2023;50(4):575-577. doi:10.3899/jrheum.22051218. Murayama A. Industry-sponsored research funding to allergists and clinical immunologists in the United States. Ann Allergy Asthma Immunol. Jun 21 2023;doi:10.1016/j.anai.2023.06.02119. Hartung DM, Johnston K, Cohen DM, Nguyen T, Deodhar A, Bourdette DN. Industry Payments to Physician Specialists Who Prescribe Repository Corticotropin. JAMA Network Open. Jun 1 2018;1(2):e180482-e180482. doi:10.1001/jamanetworkopen.2018.048220. Murayama A, Hoshi M, Saito H, et al. Nature and Trends in Personal Payments Made to the Respiratory Physicians by Pharmaceutical Companies in Japan between 2016 and 2019. Respiration. 2022;101(12):1088-1098. doi:10.1159/00052657621. Fickweiler F, Fickweiler W, Urbach E. Interactions between physicians and the pharmaceutical industry generally and sales representatives specifically and their association with physicians' attitudes and prescribing habits: a systematic review. BMJ Open. Sep 27 2017;7(9):e016408. doi:10.1136/bmjopen-2017-01640822. Fadlallah R, Nas H, Naamani D, et al. Knowledge, Beliefs and Attitudes of Patients and the General Public towards the Interactions of Physicians with the Pharmaceutical and the Device Industry: A Systematic Review. PLoS One. 2016;11(8):e0160540. doi:10.1371/journal.pone.016054023. Wen L. Patients can’t trust doctors’ advice if we hide our financial connections with drug companies. BMJ : British Medical Journal. 2014;348:g167. doi:10.1136/bmj.g16724. Pham-Kanter G, Mello MM, Lehmann LS, Campbell EG, Carpenter D. Public Awareness of and Contact With Physicians Who Receive Industry Payments: A National Survey. Journal of General Internal Medicine. 2017/07/01 2017;32(7):767-774. doi:10.1007/s11606-017-4012-325. Murayama A, Senoo Y, Harada K, et al. Awareness and Perceptions among Members of a Japanese Cancer Patient Advocacy Group Concerning the Financial Relationships between the Pharmaceutical Industry and Physicians. Int J Environ Res Public Health. Mar 15 2022;19(6)doi:10.3390/ijerph1906347826. Stein GE, Kamler JJ, Chang JS. Ophthalmology Patient Perceptions of Open Payments Information. JAMA Ophthalmology. 2018;136(12):1375-1381. doi:10.1001/jamaophthalmol.2018.416727. Barry MJ, Edgman-Levitan S. Shared Decision Making — The Pinnacle of Patient-Centered Care. New England Journal of Medicine. 2012/03/01 2012;366(9):780-781. doi:10.1056/NEJMp1109283